Even the nicest clouds have their limits
Each Azure subscription has a bunch of limits and quotas. Most of these are 'soft' limits, meaning that they can be raised on request. These limits exist to help with capacity planning and to avoid 'bill shock' by accidentally deploying a lot more than you should have.
You can view your current quotas and usage against those quotas by logging on to the Azure Portal, selecting your subscription and choosing 'Usage + quotas'. The screen alows you to request quota increases and filter the results on type of service quota, provider, location and to show all results or only results with usage:
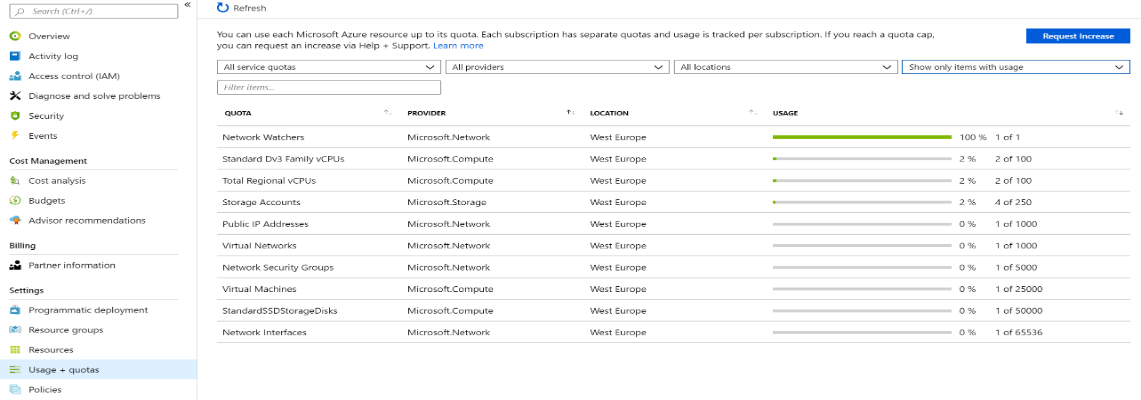
On a subscription that has only 'light' usage (like the one shown in the image), this manual process works well. It becomes more problematic in an enterprise environment where there are often many VM's, storage accounts, etc in use. When you're working on a project you probably have other things to worry about besides checking if you are reaching the limits of your subscription. Sometimes your deployments can grow quickly, and finding out you've hit limit just as you need to deploy more resources can be a pain, as getting quota increases are not instantaneous. Wouldn't it be great if you could find out when you're close to hitting your quota limits before it's too late?
Luckily this is pretty easy to do, at least for most of your quotas. Azure PowerShell includes cmdlets which will report your current usage and quotas for a range of different resource types. But you don't want to be responsible for calling these cmdlets to the check the quotas yourself, you want to be notified proactively. You could build your own notification engine, but a better option is to use something that's already available in Azure out-of-the-box. For storing and quering the data collected by the cmdlets, we'll be using a Log Analytics Workspace in Azure Monitor Logs.
Before we can use query the data and send alerts based on the Azure quotas, we need to get data into the workspace. We can write our own data into the Log Analytics Workspace by using the Log Collector API. The linked article shows a PowerShell script in which a REST API is used to do just that. Combining this script with the cmdlets Get-AzVMUsage, Get-AzStorageUsage and Get-AzNetworkUsage gives us all the data we need. You put this into an Azure Automation Runbook and configure the script to be run on a schedule (e.g. once per day). The final script looks like this:
Param(
 [string]$workspaceId,
 [string]$sharedKey,
 [string[]]$locations
)

$connectionName = "AzureRunAsConnection"
try
{
    # Get the connection "AzureRunAsConnection "

    $servicePrincipalConnection = Get-AutomationConnection -Name $connectionName

    #"Logging in to Azure..."
    $connectionResult =  Connect-AzAccount -Tenant $servicePrincipalConnection.TenantID `
                             -ApplicationId $servicePrincipalConnection.ApplicationID   `
                             -CertificateThumbprint $servicePrincipalConnection.CertificateThumbprint `
                             -ServicePrincipal
    #"Logged in."

}
catch {
    if (!$servicePrincipalConnection)
    {
        $ErrorMessage = "Connection $connectionName not found."
        throw $ErrorMessage
    } else{
        Write-Error -Message $_.Exception
        throw $_.Exception
    }
}
$LogType = "AzureQuota"

# Choose between all locations or only a fixed set
# $locations = (Get-AzLocation | Select-Object Location).Location
# $locations = ["southcentralus","northeurope","westeurope"]

$sub = (Get-AzContext).Subscription.Name
$json = ''

# Get VM quotas
foreach ($location in $locations)
{
    $vmQuotas = Get-AzVMUsage -Location $location
    foreach($vmQuota in $vmQuotas)
    {
        $usage = 0
        if ($vmQuota.Limit -gt 0) { $usage = $vmQuota.CurrentValue / $vmQuota.Limit }
        $json += @"
{ "SubscriptionName":"$sub","Name":"$($vmQuota.Name.LocalizedValue)", "Category":"Compute", "Location":"$location", "CurrentValue":$($vmQuota.CurrentValue), "Limit":$($vmQuota.Limit),"Usage":$usage },
"@
    }
}

# Get Network Quota
foreach ($location in $locations)
{
    $networkQuotas = Get-AzNetworkUsage  -location $location
    foreach ($networkQuota in $networkQuotas)
    {
        $usage = 0
        if ($networkQuota.limit -gt 0) { $usage = $networkQuota.currentValue / $networkQuota.limit }
        $json += @"
{ "SubscriptionName":"$sub","Name":"$($networkQuota.name.localizedValue)", "Category":"Network", "Location":"$location", "CurrentValue":$($networkQuota.currentValue), "Limit":$($networkQuota.limit),"Usage":$usage },
"@
    }
}

foreach ($location in $locations)
{
    # Get Storage Quota
    $storageQuotas = Get-AzStorageUsage -location $location
    foreach ($storageQuota in $storageQuotas)
    {
        $usage = 0
        if ($storageQuota.Limit -gt 0) { $usage = $storageQuota.CurrentValue / $storageQuota.Limit }
        $json += @"
{ "SubscriptionName":"$sub","Name":"$($storageQuota.LocalizedName)", "Location":"$location", "Category":"Storage", "CurrentValue":$($storageQuota.CurrentValue), "Limit":$($storageQuota.Limit),"Usage":$usage },
"@
    }
}

# Wrap in an array
$json =  $json.TrimEnd(",")
$json = "[$json]"

# Create the function to create the authorization signature
Function Build-Signature ($workspaceId, $sharedKey, $date, $contentLength, $method, $contentType, $resource)
{
    $xHeaders = "x-ms-date:" + $date
    $stringToHash = $method + "`n" + $contentLength + "`n" + $contentType + "`n" + $xHeaders + "`n" + $resource

    $bytesToHash = [Text.Encoding]::UTF8.GetBytes($stringToHash)
    $keyBytes = [Convert]::FromBase64String($sharedKey)

    $sha256 = New-Object System.Security.Cryptography.HMACSHA256
    $sha256.Key = $keyBytes
    $calculatedHash = $sha256.ComputeHash($bytesToHash)
    $encodedHash = [Convert]::ToBase64String($calculatedHash)
    $authorization = 'SharedKey {0}:{1}' -f $workspaceId,$encodedHash
    return $authorization
}

# Create the function to create and post the request
Function Post-LogAnalyticsData($workspaceId, $sharedKey, $body, $logType)
{
    $method = "POST"
    $contentType = "application/json"
    $resource = "/api/logs"
    $rfc1123date = [DateTime]::UtcNow.ToString("r")
    $contentLength = $body.Length
    $signature = Build-Signature `
        -workspaceId $workspaceId `
        -sharedKey $sharedKey `
        -date $rfc1123date `
        -contentLength $contentLength `
        -method $method `
        -contentType $contentType `
        -resource $resource
    $uri = "https://" + $workspaceId + ".ods.opinsights.azure.com" + $resource + "?api-version=2016-04-01"

    $headers = @{
        "Authorization" = $signature;
        "Log-Type" = $logType;
        "x-ms-date" = $rfc1123date;
    }

    $response = Invoke-WebRequest -Uri $uri -Method $method -ContentType $contentType -Headers $headers -Body $body -UseBasicParsing
    return $response.StatusCode

}

# Submit the data to the API endpoint
Post-LogAnalyticsData -workspaceId $workspaceId -sharedKey $sharedKey -body ([System.Text.Encoding]::UTF8.GetBytes($json)) -logType $logType
$json
When creating the Automation Account, make sure you set the 'Create Azure Run As account' to 'yes'. When creating the schedule for the Runbook, you need to supply a couple of parameters. These are the WorkspaceID, Shared Key (Primary Key) and the Azure regions (locations) you would like to report on. The first two can be found in the 'Advanced settings' section of the Log Analytics Workspace. The locations can be supplied manually in a JSON array format (e.g. ["westeurope","westus"]). You can find some comments in the script to either have it go through all locations or give it a fixed set of locations.
Once you have run the script and got some data in the workspace, you can use the Log Analytics search and alerting capabilities to query, visualise or alert on the Azure quota data. Note that as per the Log Collector API documentation, Azure Monitor will suffix both your event type and fields. So your events will have a type of AzureQuota_CL and the fields will be suffixed with _s (for strings) and _d for numbers. Running the following query in the 'Logs' blade of the Workspace will give you your raw events:
Our goal was to get notified when usage starts getting close to the set limit. We can find any instances above a threshold (say, 80%) with the following query:
Which would give you something like this:
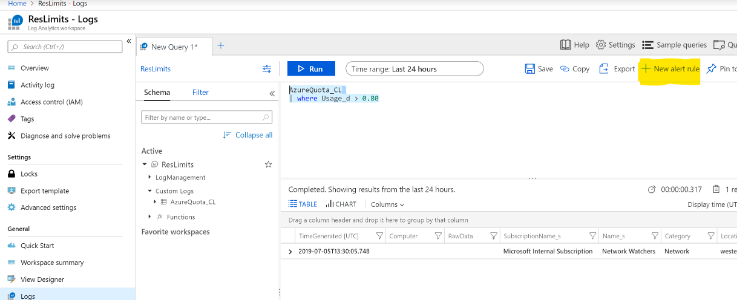
We can then use the '+ New alert rule' (see highlight in image above) functionality to set up an alert which, for example, could be emailed to you automatically. Of course you can define multiple queries and alert rules to tailor the mechanism exactly to your wishes. I am by no means an expert in the undelying Kusto query language, but there are a multitude of resources to be found online for that.
So with combining Azure Automation, PowerShell Cmdlets and Azure Monitor Log Analytics, you'll never be surprised by hitting a quota again. Hope this helps!
This post is the July 2019 version of 'Get Alerts as you approach your Azure resource quotas' written bij Tom Hollander in June 2017. I have re-used it with his permission.
Comments
Comments are closed